数据结构-二叉树可视化
二叉树可视化,包括 python 源代码,示例等.
更新
1
19.03.24 初始
- 参考资料
https://blog.csdn.net/hackooo/article/details/10564049
https://graphviz.readthedocs.io/en/stable/examples.html
导语
- 之前冗余的各种重复的代码彻底整理一遍,被python的相对路径折腾死了.
- 原本打算一块写了,但可视化这部分比较独立,拿出来单独一篇.剩下的内容写在2-3树的前日谭里了.
- 二叉树可视化,目前支持红黑和普通二叉树,调试方便多了..
二叉树可视化
目标
- 方便导出(后面有制作 gif 的打算)
- 支持各类图的绘制.(图的一堆算法在计划列表)
- 跨平台.(win/linux)
方案
- 尝试了不少直接输出到命令行,终究还是不方便导出,故放弃.
- 绘图,matplotlib,杀鸡焉用宰牛刀(其实有点复杂,学习曲线有点陡)..故放弃.
- 直到想起之前遇到的表述图形描述语言 dot ,找到了 Graphviz .
Graphviz
Graphviz : 由AT&T实验室启动的开源工具包,用于绘制DOT语言脚本描述的图形.使用非常方便.
最为重要的是 dot + Graphviz 完美的支持了各类图的绘制,表示图的算法时候会简单很多.
安装
python中
1
pip install graphviz
这里可以在python中使用 Graphviz 的库,输出 dot 文件了,但还不能渲染出图片.需要系统安装 Graphviz
1
sudo apt-get install graphviz
dot语言
dot 语言是一种文本图形描述语言,一般 dot 文件以 .gv 或是 .dot 结尾.
dot的语法非常简单,要求也并不严格,注释格式等与c语言相同.
这里仅提及部分语法,完整请参考 Dot中文版教程.
这里二叉树的绘制参考
https://blog.csdn.net/hackooo/article/details/10564049
示例
1
2
3
4
5
6
7
8
9
10
11
12
13
14
15
/*digraph 代表有向图 */
digraph tree {
/*node的属性设置,全局 可单个覆盖*/
/*默认 底色: 黑 字体颜色: 白 节点形状: 矩形 类型: 充满*/
node [color=black fontcolor=white shape=record style=filled]
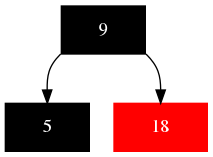
/*9 节点 占位 占位 显示 占位*/
9 [label="<f0> |<f1> 9|<f2>"]
5 [label="<f0> |<f1> 5|<f2>"]
/*连接(箭头) sw即 9:f0的左下角 */
9:f0:sw -> 5:f1
/*颜色变为红色*/
18 [label="<f0> |<f1> 18|<f2>" color=red]
/*连接(箭头) se即 9:f2的右下角 */
9:f2:se -> 18:f1
}渲染后的图像
![tree]()
可视化
这里要在 python 代码中生成上面的 dot 文本,实际上也非常简单.
代码
1
2
3
4
5
6
7
8
9
10
11
12
13
14
15
16
17
18
19
20
21
22
23
24
#!/usr/bin/python3
from graphviz import Digraph, nohtml
if __name__ == "__main__":
dot = Digraph(
name='tree',
comment='Tree',
node_attr={
'shape': 'record',
'style': 'filled',
'color': 'black',
'fontcolor': 'white'
})
dot.node('9', nohtml('<f0> |<f1> 9|<f2>'))
dot.node('5', nohtml('<f0> |<f1> 5|<f2>'))
dot.edge('9:f0:sw', '5:f1')
dot.node('18', nohtml('<f0> |<f1> 18|<f2>'), color='red')
dot.edge('9:f2:se', '18:f1')
print(dot.source)
# 指定输出的参数.
dot.render(
filename=None, directory=None, view=False, cleanup=False, format='png')
# 只简单看看效果直接
# dot.view()
模块
这里结合二叉树的先须遍历,写成模块形式.
代码
1
2
3
4
5
6
7
8
9
10
11
12
13
14
15
16
17
18
19
20
21
22
23
24
25
26
27
28
29
30
31
32
33
34
35
36
37
38
39
40
41
42
#!/usr/bin/python3
from graphviz import Digraph, nohtml
class prtree(object):
def node(self, dot, node):
if node.color:
# 红黑
dot.node(
'%s' % (node.key),
nohtml('<f0> |<f1> %s|<f2>' % (node.value)),
color='%s' % (node.color))
else:
# 普通
dot.node('%s' % (node.key),
nohtml('<f0> |<f1> %s|<f2>' % (node.value)))
def tree(self, dot, root):
if root:
self.node(dot, root)
if root.lchild:
# 链接左子树
dot.edge('%s:f0:sw' % (root.key), '%s:f1' % (root.lchild.key))
self.tree(dot, root.lchild)
if root.rchild:
# 链接右子树
dot.edge('%s:f2:se' % (root.key), '%s:f1' % (root.rchild.key))
self.tree(dot, root.rchild)
def dot(self, root):
dots = Digraph(
name='terr',
comment='Tree',
node_attr={
'shape': 'record',
'style': 'filled',
'color': 'black', # 默认为黑色
'fontcolor': 'white' # 字体颜色
})
self.tree(dots, root)
return dots测试(二叉搜索树)
1
2
3
4
5
6
7
8
9
10
11
12
if __name__ == "__main__":
d = randoms.dict_int(n=15)
test = bst()
for k, v in d.items():
test.insert(k, v)
prt = prtree()
dot = prt.dot(test.root)
print(dot.source)
dot.render(
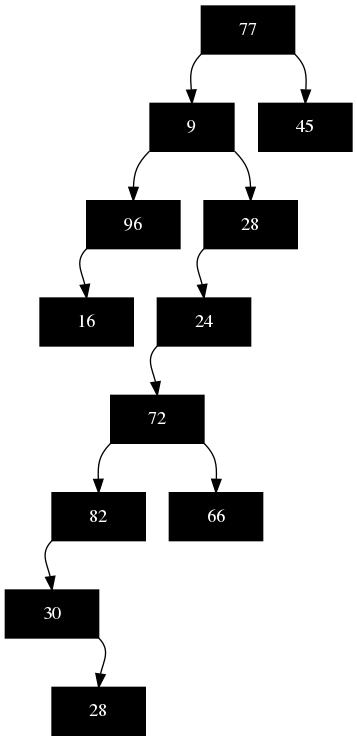
filename=None, directory=None, view=False, cleanup=False, format='png')效果
![tree]()
- 二叉树已经很好的表示出来了,这里也能看出来,单纯二叉搜索树,对深度的控制非常差.
结语
- 写这篇的时候才发现图床要在3月底关闭了,ai,去搬运图片了,2-3树延后…
相关文章